Score health utility
Categories:
This below section renders a vignette article from the scorz library. You can use the following links to:
- view the vignette on the library website (adds useful hyperlinks to code blocks)
- view the source file from that article, and;
- edit its contents (requires a GitHub account).
Note: This vignette is illustrated with fake data. The dataset explored in this example should not be used to inform decision-making. Some of the methods illustrated in this AQoL-6D vignette can also be used to score other health utility instruments - see a vignette about scoring EQ-5D.
AQoL-6D scoring
To derive a health utility score from the raw responses to a multi-attribute utility instrument it is necessary to implement a scoring algorithm. Scoring algorithms for the Assessment of Quality of Life Six Dimension (AQoL-6D) are publicly available in SPSS format (https://www.aqol.com.au/index.php/scoring-algorithms).
However, to include scoring algorithms in reproducible research workflows, it is desirable to have these algorithms available in open science languages such as R. The scorz package includes ready4 framework model modules of the ready4 youth mental health economic model that provide R implementations of the adult and adolescent versions of the AQoL-6D scoring algorithms.
Ingest data
To begin, we ingest an unscored dataset as an instance of the Ready4useDyad from the ready4use package. In this case we download our data from a remote repository.
X <- ready4use::Ready4useRepos(dv_nm_1L_chr = "fakes",
                               dv_ds_nm_1L_chr = "https://doi.org/10.7910/DVN/W95KED",
                               dv_server_1L_chr = "dataverse.harvard.edu") %>%
  ingest(fls_to_ingest_chr = "ymh_clinical_dyad_r4",
         metadata_1L_lgl = F)
To make the ingested dataset easier to interpret, we can add labels from the dictionary.
We can now inspect our ingested dataset using the exhibit method.
exhibit(X,
        display_1L_chr = "head",
         scroll_box_args_ls = list(width = "100%"))
| Unique client identifier | Round of data collection | Date of data collection | Age | Gender | Sex at birth | Sexual orientation | Aboriginal or Torres Strait Islander | Country Of birth | Speaks English at home | Native English speaker | Education and employment status | Relationship status | Service centre name | Primary diagnosis | Clinical stage | Kessler Psychological Distress Scale (6 Dimension) | Patient Health Questionnaire | Behavioural Activation for Depression Scale | Generalised Anxiety Disorder Scale | Overall Anxiety Severity and Impairment Scale | Screen for Child Anxiety Related Disorders | Social and Occupational Functioning Assessment Scale | Assessment of Quality of Life (6 Dimension) question 1 | Assessment of Quality of Life (6 Dimension) question 2 | Assessment of Quality of Life (6 Dimension) question 3 | Assessment of Quality of Life (6 Dimension) question 4 | Assessment of Quality of Life (6 Dimension) question 5 | Assessment of Quality of Life (6 Dimension) question 6 | Assessment of Quality of Life (6 Dimension) question 7 | Assessment of Quality of Life (6 Dimension) question 8 | Assessment of Quality of Life (6 Dimension) question 9 | Assessment of Quality of Life (6 Dimension) question 10 | Assessment of Quality of Life (6 Dimension) question 11 | Assessment of Quality of Life (6 Dimension) question 12 | Assessment of Quality of Life (6 Dimension) question 13 | Assessment of Quality of Life (6 Dimension) question 14 | Assessment of Quality of Life (6 Dimension) question 15 | Assessment of Quality of Life (6 Dimension) question 16 | Assessment of Quality of Life (6 Dimension) question 17 | Assessment of Quality of Life (6 Dimension) question 18 | Assessment of Quality of Life (6 Dimension) question 19 | Assessment of Quality of Life (6 Dimension) question 20 |
|---|---|---|---|---|---|---|---|---|---|---|---|---|---|---|---|---|---|---|---|---|---|---|---|---|---|---|---|---|---|---|---|---|---|---|---|---|---|---|---|---|---|---|
| Participant_1 | Baseline | 2020-03-22 | 14 | Male | Male | Heterosexual | No | Australia | Yes | Yes | Not studying or working | In a relationship | Southport | Other | 0-1a | 8 | 7 | 96 | 6 | 6 | 28 | 69 | 2 | 3 | 1 | 2 | 3 | 1 | 1 | 2 | 4 | 3 | 3 | 4 | 2 | 4 | 2 | 2 | 2 | 2 | 2 | 1 |
| Participant_2 | Baseline | 2020-06-15 | 19 | Female | Female | Heterosexual | Yes | Other | No | No | Studying only | In a relationship | Regional Centre | Anxiety | 0-1a | 13 | 13 | 63 | 12 | 12 | 41 | 58 | 3 | 3 | 1 | 1 | 3 | 2 | 1 | 3 | 2 | 4 | 4 | 3 | 4 | 3 | 1 | 2 | 2 | 2 | 1 | 1 |
| Participant_3 | Baseline | 2020-08-20 | 21 | Female | Female | Other | NA | NA | NA | NA | Studying only | Not in a relationship | Canberra | Anxiety | 1b | 12 | 17 | 72 | 16 | 12 | 43 | 72 | 2 | 3 | 2 | 5 | 1 | 1 | 1 | 2 | 4 | 5 | 2 | 4 | 2 | 2 | 2 | 1 | 1 | 1 | 1 | 1 |
| Participant_4 | Baseline | 2020-05-23 | 12 | Female | Female | Heterosexual | Yes | Other | No | No | Not studying or working | In a relationship | Southport | Depression and Anxiety | 2-4 | 17 | 17 | 75 | 12 | 10 | 51 | 88 | 1 | 2 | 1 | 1 | 3 | 3 | 1 | 4 | 4 | 3 | 3 | 3 | 4 | 2 | 1 | 1 | 2 | 1 | 3 | 1 |
| Participant_5 | Baseline | 2020-04-05 | 19 | Male | Male | Heterosexual | Yes | Other | No | No | Not studying or working | Not in a relationship | Southport | Depression and Anxiety | 0-1a | 12 | 22 | 82 | 14 | 14 | 51 | 67 | 2 | 2 | 1 | 3 | 5 | 1 | 1 | 1 | 1 | 5 | 4 | 4 | 3 | 2 | 1 | 2 | 1 | 3 | 2 | 3 |
| Participant_6 | Baseline | 2020-06-09 | 19 | Male | Male | Heterosexual | Yes | Other | No | No | Studying only | In a relationship | Regional Centre | Anxiety | 1b | 11 | 8 | 105 | 8 | 3 | 46 | 60 | 1 | 2 | 2 | 1 | 2 | 2 | 4 | 1 | 3 | 3 | 4 | 3 | 4 | 2 | 1 | 2 | 1 | 2 | 1 | 1 |
We now add meta-data that identifies our dataset as being longitudinal using the YouthvarsSeries module of the youthvars package.
X <- youthvars::YouthvarsSeries(a_Ready4useDyad = X,
                                id_var_nm_1L_chr = "fkClientID",
                                timepoint_var_nm_1L_chr = "round",
                                timepoint_vals_chr = levels(X@ds_tb$round))
We now use the data and meta-data we have created in the previous steps to create an instance of the ScorzAqol6Adol class. This class is specifically designed to facilitate scoring of the adolescent version of the AQoL-6D instrument.
Y <- ScorzAqol6Adol(a_YouthvarsProfile = X)By default, instances of the ScorzAqol6Adol class are created with a slot specifying a value for the prefix for AQoL-6D questionnaire item responses.
procureSlot(Y,
            slot_nm_1L_chr = "itm_prefix_1L_chr")
#> [1] "aqol6d_q"
If this default value needs to be updated to match the prefix used in your dataset, use the renewSlot method.
# Not run
# Y <- renewSlot(Y, slot_nm_1L_chr = "itm_prefix_1L_chr", new_val_xx = "new_prefix")
Calculating scores
To calculate AQoL 6D adolescent utility scores, use the renew method.
Y <- renew(Y)Viewing the updated dataset
We can inspect our updated dataset using the exhibit method. We can see that the updated dataset now has additional variables that include the intermediate and final calculations for AQoL-6D adolescent utility scores.
exhibit(Y,
        display_1L_chr = "head",
         scroll_box_args_ls = list(width = "100%"))
| Unique client identifier | Round of data collection | Date of data collection | Age | Gender | Sex at birth | Sexual orientation | Aboriginal or Torres Strait Islander | Country Of birth | Speaks English at home | Native English speaker | Education and employment status | Relationship status | Service centre name | Primary diagnosis | Clinical stage | Kessler Psychological Distress Scale (6 Dimension) | Patient Health Questionnaire | Behavioural Activation for Depression Scale | Generalised Anxiety Disorder Scale | Overall Anxiety Severity and Impairment Scale | Screen for Child Anxiety Related Disorders | Social and Occupational Functioning Assessment Scale | Assessment of Quality of Life (6 Dimension) question 1 | Assessment of Quality of Life (6 Dimension) question 2 | Assessment of Quality of Life (6 Dimension) question 3 | Assessment of Quality of Life (6 Dimension) question 4 | Assessment of Quality of Life (6 Dimension) question 5 | Assessment of Quality of Life (6 Dimension) question 6 | Assessment of Quality of Life (6 Dimension) question 7 | Assessment of Quality of Life (6 Dimension) question 8 | Assessment of Quality of Life (6 Dimension) question 9 | Assessment of Quality of Life (6 Dimension) question 10 | Assessment of Quality of Life (6 Dimension) question 11 | Assessment of Quality of Life (6 Dimension) question 12 | Assessment of Quality of Life (6 Dimension) question 13 | Assessment of Quality of Life (6 Dimension) question 14 | Assessment of Quality of Life (6 Dimension) question 15 | Assessment of Quality of Life (6 Dimension) question 16 | Assessment of Quality of Life (6 Dimension) question 17 | Assessment of Quality of Life (6 Dimension) question 18 | Assessment of Quality of Life (6 Dimension) question 19 | Assessment of Quality of Life (6 Dimension) question 20 | Assessment of Quality of Life (6 Dimension) item disvalue1 | Assessment of Quality of Life (6 Dimension) item disvalue2 | Assessment of Quality of Life (6 Dimension) item disvalue3 | Assessment of Quality of Life (6 Dimension) item disvalue4 | Assessment of Quality of Life (6 Dimension) item disvalue5 | Assessment of Quality of Life (6 Dimension) item disvalue6 | Assessment of Quality of Life (6 Dimension) item disvalue7 | Assessment of Quality of Life (6 Dimension) item disvalue8 | Assessment of Quality of Life (6 Dimension) item disvalue9 | Assessment of Quality of Life (6 Dimension) item disvalue10 | Assessment of Quality of Life (6 Dimension) item disvalue11 | Assessment of Quality of Life (6 Dimension) item disvalue12 | Assessment of Quality of Life (6 Dimension) item disvalue13 | Assessment of Quality of Life (6 Dimension) item disvalue14 | Assessment of Quality of Life (6 Dimension) item disvalue15 | Assessment of Quality of Life (6 Dimension) item disvalue16 | Assessment of Quality of Life (6 Dimension) item disvalue17 | Assessment of Quality of Life (6 Dimension) item disvalue18 | Assessment of Quality of Life (6 Dimension) item disvalue19 | Assessment of Quality of Life (6 Dimension) item disvalue20 | Disvalue Score for Dimension 1 - Independent Living | Disvalue Score for Dimension 2 - Relationships | Disvalue Score for Dimension 3 - Mental Health | Disvalue Score for Dimension 4 - Coping | Disvalue Score for Dimension 5 - Pain | Disvalue Score for Dimension 6 - Senses | Adult Score Dimension 1 - Independent Living | Adult Score Dimension 2 - Relationships | Adult Score Dimension 3 - Mental Health | Adult Score Dimension 4 - Coping | Adult Score Dimension 5 - Pain | Adult Score Dimension 6 - Senses | Overall score on a 0-1 disvalue scale | Overall score on a life-death disutility scale | AQoL-6D Adolescent Disutility Score (Untransformed) | AQoL-6D Adolescent Disutility Score (Transformed) | Instrument utility score | Instrument utility score rotated | AQOL-6D (weighted total) | AQOL-6D (unweighted total) |
|---|---|---|---|---|---|---|---|---|---|---|---|---|---|---|---|---|---|---|---|---|---|---|---|---|---|---|---|---|---|---|---|---|---|---|---|---|---|---|---|---|---|---|---|---|---|---|---|---|---|---|---|---|---|---|---|---|---|---|---|---|---|---|---|---|---|---|---|---|---|---|---|---|---|---|---|---|---|---|---|---|---|---|
| Participant_1 | Baseline | 2020-03-22 | 14 | Male | Male | Heterosexual | No | Australia | Yes | Yes | Not studying or working | In a relationship | Southport | Other | 0-1a | 8 | 7 | 96 | 6 | 6 | 28 | 69 | 2 | 3 | 1 | 2 | 3 | 1 | 1 | 2 | 4 | 3 | 3 | 4 | 2 | 4 | 2 | 2 | 2 | 2 | 2 | 1 | 0.073 | 0.240 | 0.000 | 0.040 | 0.461 | 0.000 | 0.000 | 0.133 | 0.824 | 0.330 | 0.368 | 0.722 | 0.055 | 0.826 | 0.133 | 0.2 | 0.072 | 0.033 | 0.024 | 0.000 | 0.19334101 | 0.2964368 | 0.7312060 | 0.7708396 | 0.2619285 | 0.03009428 | 0.8066590 | 0.7035632 | 0.2687940 | 0.2291604 | 0.7380715 | 0.9699057 | 0.6436897 | 0.7286568 | 0.55838936 | 0.55838936 | 0.4416106 | 0.5078265 | 0.5698492 | 46 |
| Participant_10 | Baseline | 2020-08-05 | 15 | Female | Female | Other | Yes | Other | No | No | Studying and working | Not in a relationship | Canberra | Other | 0-1a | 11 | 17 | 34 | 13 | 15 | 38 | 60 | 1 | 2 | 2 | 3 | 5 | 1 | 3 | 3 | 4 | 4 | 3 | 4 | 3 | 3 | 1 | 2 | 2 | 3 | 2 | 1 | 0.000 | 0.033 | 0.041 | 0.297 | 1.000 | 0.000 | 0.648 | 0.392 | 0.824 | 0.784 | 0.368 | 0.722 | 0.382 | 0.423 | 0.000 | 0.2 | 0.072 | 0.223 | 0.024 | 0.000 | 0.27064870 | 0.7770111 | 0.8683514 | 0.6579841 | 0.1935407 | 0.13938313 | 0.7293513 | 0.2229889 | 0.1316486 | 0.3420159 | 0.8064593 | 0.8606169 | 0.7541542 | 0.8537026 | 0.74739738 | 0.74739738 | 0.2526026 | 0.3413671 | 0.3916050 | 52 |
| Participant_10 | Follow-up | 2020-11-07 | 15 | Female | Female | Other | Yes | Other | No | No | Not studying or working | Not in a relationship | Regional Centre | Depression | 1b | 7 | 17 | 95 | 14 | 10 | 48 | 64 | 2 | 3 | 2 | 1 | 2 | 2 | 2 | 2 | 2 | 3 | 3 | 5 | 3 | 2 | 3 | 1 | 2 | 2 | 3 | 2 | 0.073 | 0.240 | 0.041 | 0.000 | 0.074 | 0.193 | 0.197 | 0.133 | 0.142 | 0.330 | 0.368 | 1.000 | 0.382 | 0.057 | 0.642 | 0.0 | 0.072 | 0.033 | 0.205 | 0.187 | 0.18835933 | 0.2602305 | 0.5155772 | 0.5858738 | 0.4342728 | 0.21476953 | 0.8116407 | 0.7397695 | 0.4844228 | 0.4141262 | 0.5657272 | 0.7852305 | 0.6473112 | 0.7327563 | 0.56418597 | 0.56418597 | 0.4358140 | 0.5027214 | 0.5645345 | 47 |
| Participant_100 | Baseline | 2020-07-19 | 25 | Female | Female | Other | Yes | Other | No | No | Working only | In a relationship | Canberra | Depression and Anxiety | 0-1a | 7 | 0 | 120 | 3 | 0 | 21 | 76 | 1 | 1 | 1 | 1 | 2 | 1 | 2 | 2 | 2 | 2 | 2 | 2 | 5 | 3 | 2 | 1 | 3 | 1 | 1 | 1 | 0.000 | 0.000 | 0.000 | 0.000 | 0.074 | 0.000 | 0.197 | 0.133 | 0.142 | 0.097 | 0.064 | 0.056 | 1.000 | 0.423 | 0.133 | 0.0 | 0.338 | 0.000 | 0.000 | 0.000 | 0.00000000 | 0.1433888 | 0.2505682 | 0.7769222 | 0.2866694 | 0.00000000 | 1.0000000 | 0.8566112 | 0.7494318 | 0.2230778 | 0.7133306 | 1.0000000 | 0.4558633 | 0.5160373 | 0.29587849 | 0.29587849 | 0.7041215 | 0.7390198 | 0.7978085 | 36 |
| Participant_1000 | Baseline | 2020-09-06 | 16 | Male | Male | Heterosexual | Yes | Other | No | No | Not studying or working | Not in a relationship | Canberra | Anxiety | 0-1a | 0 | 0 | 128 | 0 | 0 | 0 | 71 | 2 | 1 | 1 | 1 | 1 | 2 | 1 | 2 | 1 | 2 | 2 | 1 | 2 | 3 | 1 | 1 | 1 | 2 | 1 | 1 | 0.073 | 0.000 | 0.000 | 0.000 | 0.000 | 0.193 | 0.000 | 0.133 | 0.000 | 0.097 | 0.064 | 0.000 | 0.055 | 0.423 | 0.000 | 0.0 | 0.000 | 0.033 | 0.000 | 0.000 | 0.02813508 | 0.1346642 | 0.1819574 | 0.3514811 | 0.0000000 | 0.01916297 | 0.9718649 | 0.8653358 | 0.8180426 | 0.6485189 | 1.0000000 | 0.9808370 | 0.2379252 | 0.2693314 | 0.08939064 | 0.08939064 | 0.9106094 | 0.9208737 | 0.9511345 | 29 |
| Participant_1000 | Follow-up | 2020-12-20 | 16 | Male | Male | Heterosexual | Yes | Other | No | No | Not studying or working | Not in a relationship | Southport | Anxiety | 1b | 5 | 0 | 117 | 5 | 1 | 14 | 71 | 2 | 2 | 1 | 1 | 1 | 1 | 2 | 1 | 3 | 1 | 2 | 3 | 2 | 2 | 1 | 1 | 1 | 1 | 2 | 1 | 0.073 | 0.033 | 0.000 | 0.000 | 0.000 | 0.000 | 0.197 | 0.000 | 0.392 | 0.000 | 0.064 | 0.338 | 0.055 | 0.057 | 0.000 | 0.0 | 0.000 | 0.000 | 0.024 | 0.000 | 0.04719190 | 0.1002056 | 0.2658587 | 0.2080310 | 0.0000000 | 0.01111253 | 0.9528081 | 0.8997944 | 0.7341413 | 0.7919690 | 1.0000000 | 0.9888875 | 0.2228889 | 0.2523102 | 0.07926885 | 0.07926885 | 0.9207312 | 0.9297879 | 0.9576133 | 31 |
Creating summary plots
To create plots, we use the depict method.
We can create a list of summary plots by timepoint for all individual items.
plot_ls <- depict(Y, type_1L_chr = "item_by_time")We can then select a desired item’s summary plot by using its index number.
plot_ls[[1]]
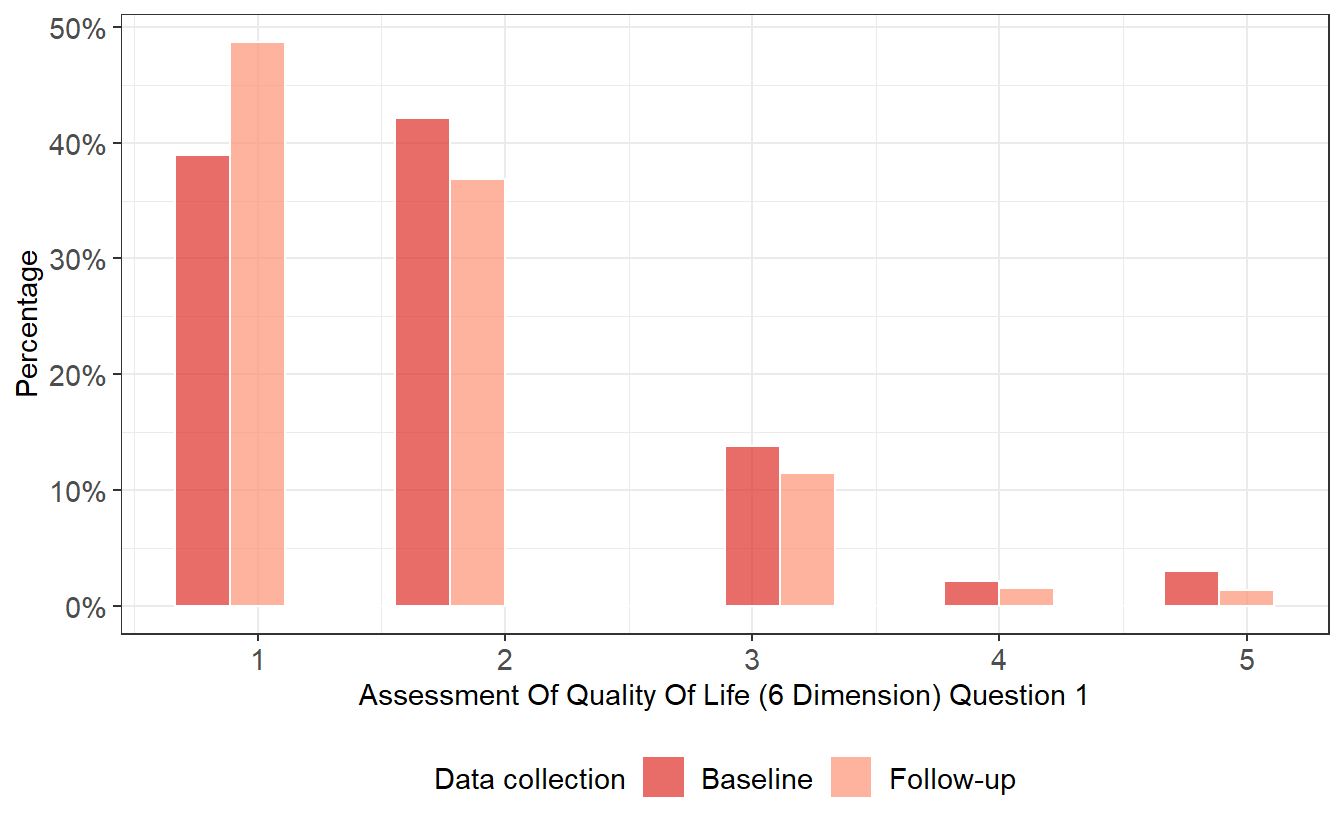
AQoL-6D Item 1 scores by data-collection round
Alternatively, we can generate individual plots by passing the item index number to the var_idcs_int argument of depict.
depict(Y, type_1L_chr = "item_by_time", var_idcs_int = 2L)
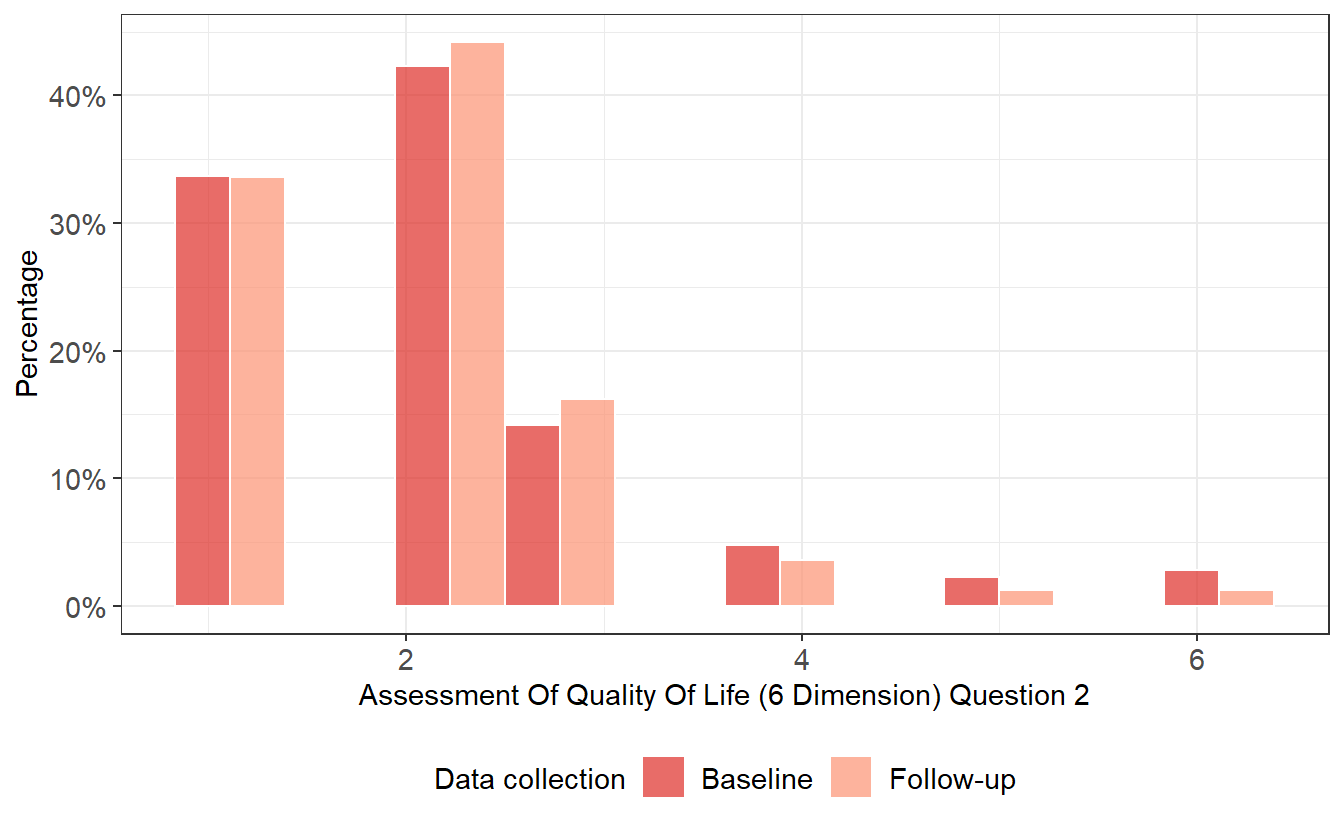
AQoL-6D Item 2 scores by data-collection round
We can also plot domain scores by time.
depict(Y, type_1L_chr = "domain_by_time", var_idcs_int = 1L)
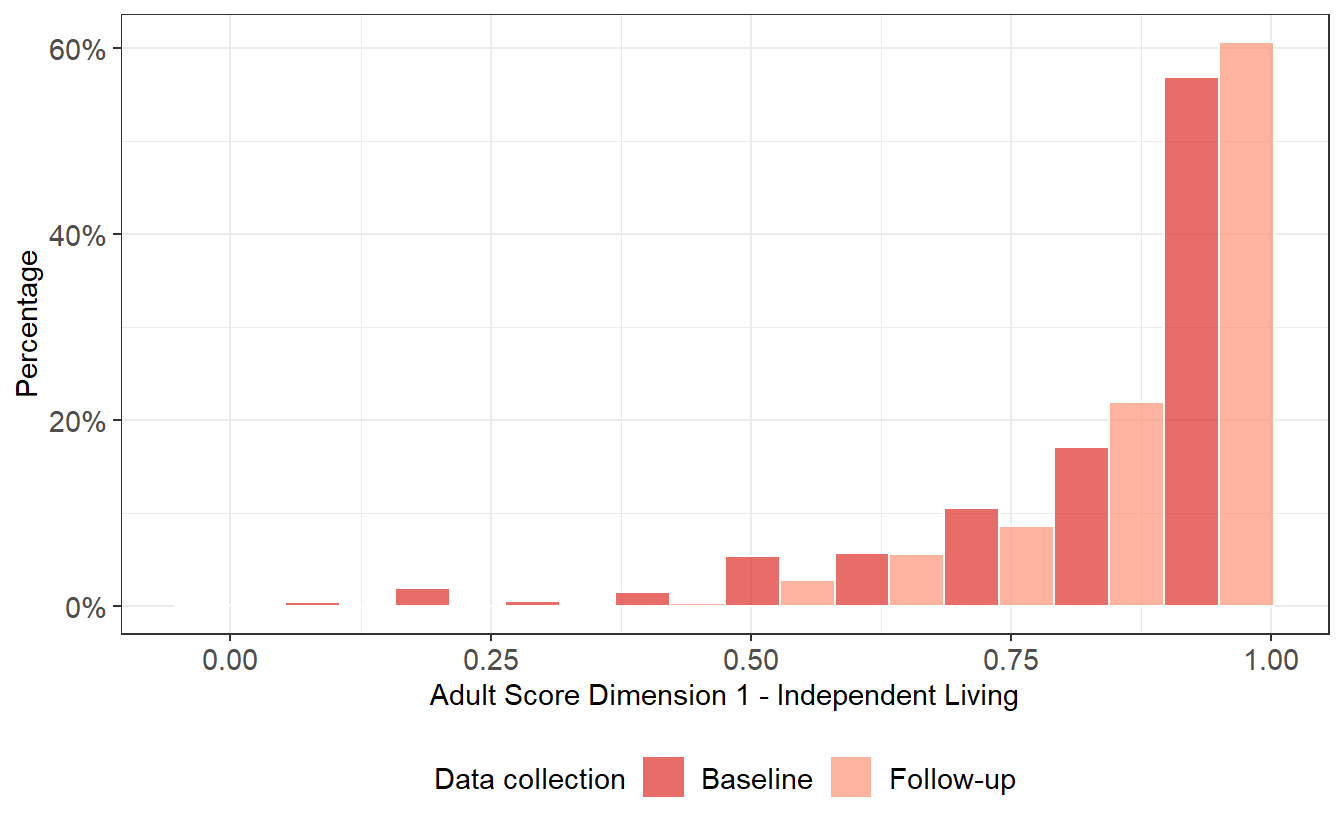
AQoL-6D Independet Living Domain weighted scores by data-collection round
Total AQoL-6D scores can also be plotted using the same approach, where var_idcs_int = 1L is used to plot the weighted total distribution and var_idcs_int = 2L is used for plotting the unweighted total.
depict(Y, type_1L_chr = "total_by_time", var_idcs_int = 1L)
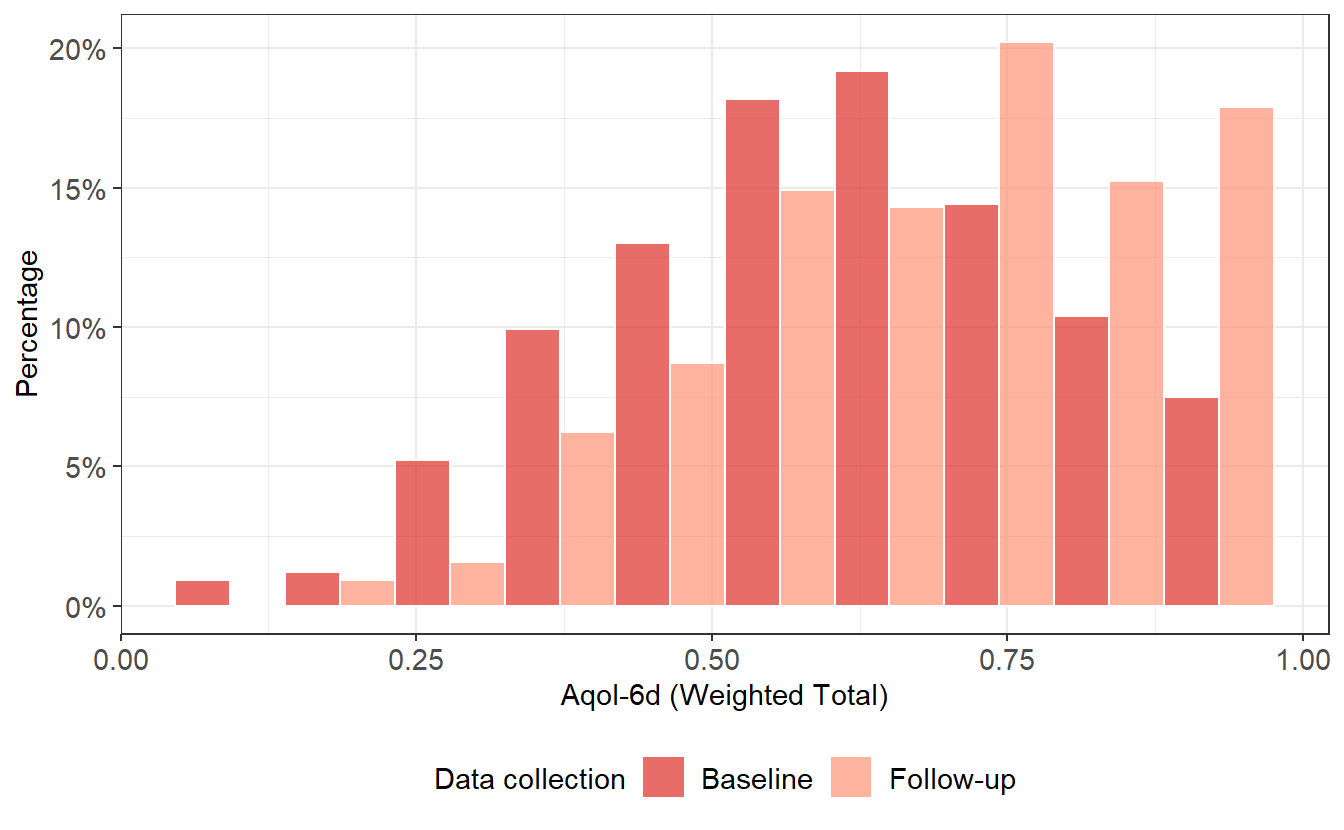
AQoL-6D item total weighted scores by data-collection round
Composite plots can be generated as well, though these are not currently optimised to reliably produce quality plots suitable for publication.
depict(Y, type_1L_chr = "comp_item_by_time")
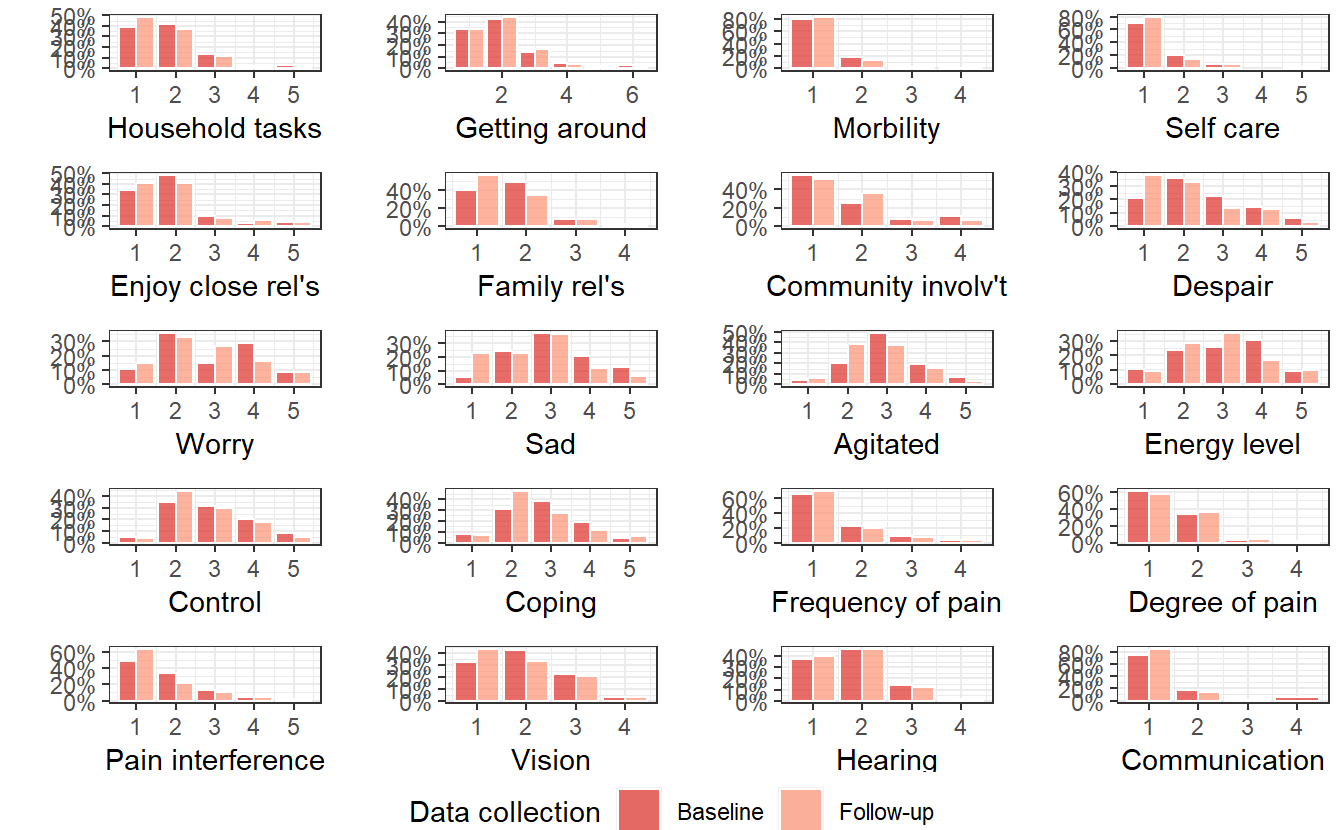
AQoL-6D item responses by data-collection round
depict(Y, type_1L_chr = "comp_domain_by_time")
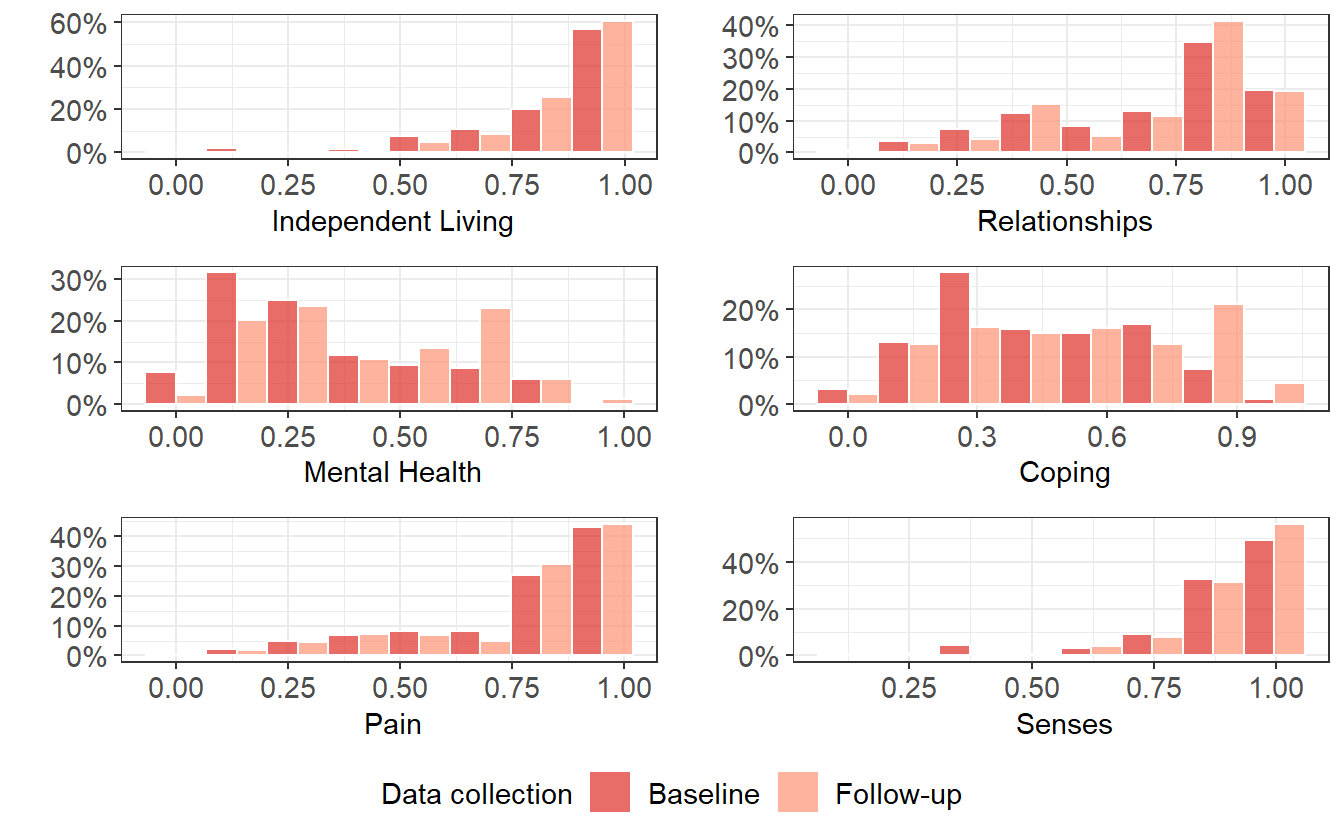
AQoL-6D weighted domain scores by data-collection round
Share output
We can now publicly share our scored dataset and its associated metadata, using Ready4useRepos and its share method as described in a vignette from the ready4use package.
Z <- ready4use::Ready4useRepos(gh_repo_1L_chr = "ready4-dev/scorz", # Replace with details of your repo.
                               gh_tag_1L_chr = "Documentation_0.0") # You must have write permissions.
Z <- share(Z,
           obj_to_share_xx = Y,
           fl_nm_1L_chr = "ymh_ScorzAqol6Adol")
Y is now available for download as the file ymh_ScorzAqol6Adol.RDS from the “Documentation_0.0” release of the scorz package.